Redlined Neighborhoods Have Higher Levels of Air Pollution, Study Suggests
A new analysis documents a link between discriminatory housing practices and local air quality
/https://tf-cmsv2-smithsonianmag-media.s3.amazonaws.com/accounts/headshot/SarahKuta.png)
:focal(835x523:836x524)/https://tf-cmsv2-smithsonianmag-media.s3.amazonaws.com/filer_public/30/71/307152be-b534-403b-9bd0-4b3c29519f5e/gettyimages-1155320185.jpg)
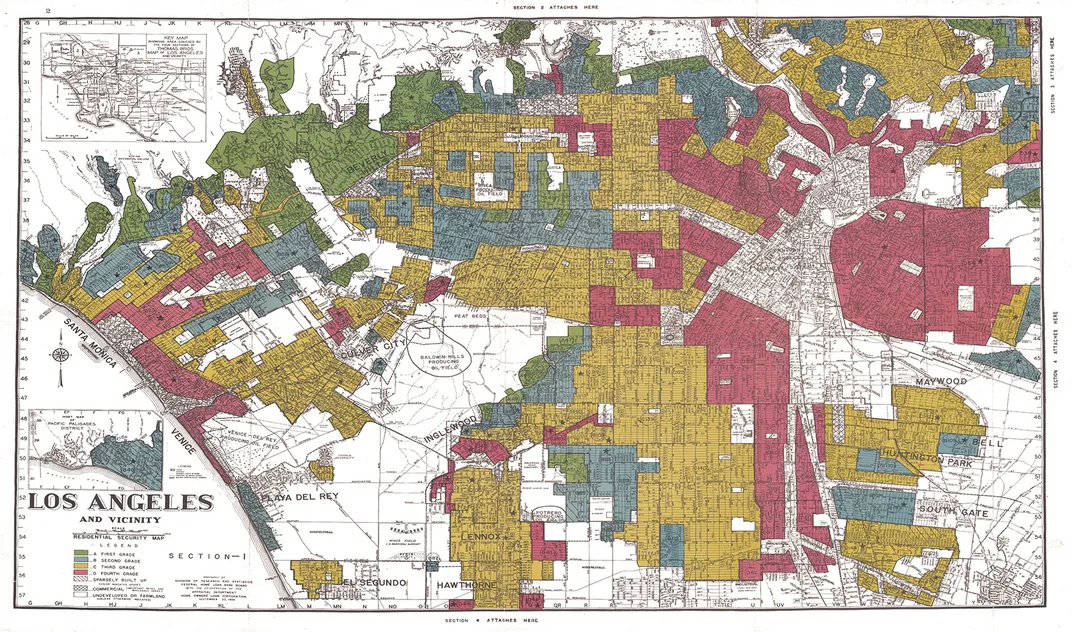
In the 1930s, the federal government rated urban neighborhoods based on their perceived worthiness for home loans, frequently giving areas with many Black and immigrant residents the lowest grade of “D,” for hazardous. Known as redlining, the discriminatory practice was outlawed in 1968. But its effects continue to reverberate today, with formerly redlined neighborhoods facing heightened economic inequality; hotter temperatures; and, a new study suggests, higher levels of air pollution.
As Erin McCormick reports for the Guardian, the study found that “D”-grade neighborhoods experienced 56 percent higher levels of nitrogen dioxide, a gas emitted by vehicles and industrial plants, in 2010 than top-rated “A” neighborhoods. Researchers at the University of California, Berkeley, and the University of Washington published their findings in the journal Environmental Science & Technology Letters last week.
“We see a really clear association between how these maps were drawn in the ’30s and the air pollution disparities today,” study co-author Joshua Apte, an environmental engineer and environmental health sciences expert at Berkeley, tells NPR’s Laurel Wamsley. “And that's not surprising, but it is very striking.”
/https://tf-cmsv2-smithsonianmag-media.s3.amazonaws.com/filer_public/d0/d6/d0d64152-fc22-4906-82ef-ed3aae71da69/d7.jpg)
The scientists spent two years analyzing 2010 census demographics (the most recent data available at the time of the study) and air pollution levels for 202 cities across the United States. Per a statement, they looked at two pollutants: nitrogen dioxide and PM2.5, or tiny airborne particles found in smoke, dust and other substances. The team then compared this data with 1930s maps created by the federally backed Home Owners' Loan Corporation (HOLC) in the wake of the Great Depression.
The HOLC’s surveyors awarded an “A” grade to neighborhoods they considered the most desirable for mortgage lending—in other words, areas inhabited mostly by white residents. They gave a “D” grade to neighborhoods deemed the riskiest for home loans, denoting these areas (made up primarily by residents of color) by shading them red on maps.
Thanks to redlining, people living in low-rated neighborhoods received less-favorable loan terms or couldn’t get government-backed mortgages at all. The 1968 Fair Housing Act banned racial discrimination in housing, but the effects of the decades-long practice still linger today. Previous research has found that historically redlined neighborhoods, which are more likely to have high populations of Black, Latino and Asian residents, have less green space, fewer trees and higher asthma rates.
Lead author Haley M. Lane, a civil and environmental engineer at Berkeley, says she was surprised to learn that differences in air pollution levels between redlined and higher-rated neighborhoods were even wider than the established racial gap in exposure for people of color and white Americans.
“At the same time,” Lane tells the New York Times’ Raymond Zhong and Nadja Popovich, “there are so many other effects that are creating these disparities, and these delineations by redlining are just one.”
The study, which was funded in part by the Environmental Protection Agency, adds to the growing body of evidence about the negative effects of discriminatory housing practices—a field of study made more accessible when experts at the University of Richmond’s Digital Scholarship Lab digitized many redline maps in 2016. Previous research has linked exposure to air pollution with an increased risk of premature death.
“This groundbreaking study builds on the solid empirical evidence that systemic racism is killing and making people of color sick,” Robert D. Bullard, an expert on urban planning and environmental policy at Texas Southern University who was not involved with the study, tells the Washington Post’s Darryl Fears. “[I]t’s just that simple.”
/https://tf-cmsv2-smithsonianmag-media.s3.amazonaws.com/accounts/headshot/SarahKuta.png)